Nowadays, we have PurgeCSS, which is cool at identifying what CSS is being used and not. But did you know Chrome also has the option to show you what CSS and JavaScript are being used and what not?
Yes, Chrome has a Code Coverage tool!
Finding the Chrome coverage tool
We can access this tool by opening up the development tools.
Mac Cmd + Shift + C or Windows: Ctrl + Shift + C.
Next click the three dots -> More tools -> Coverage.
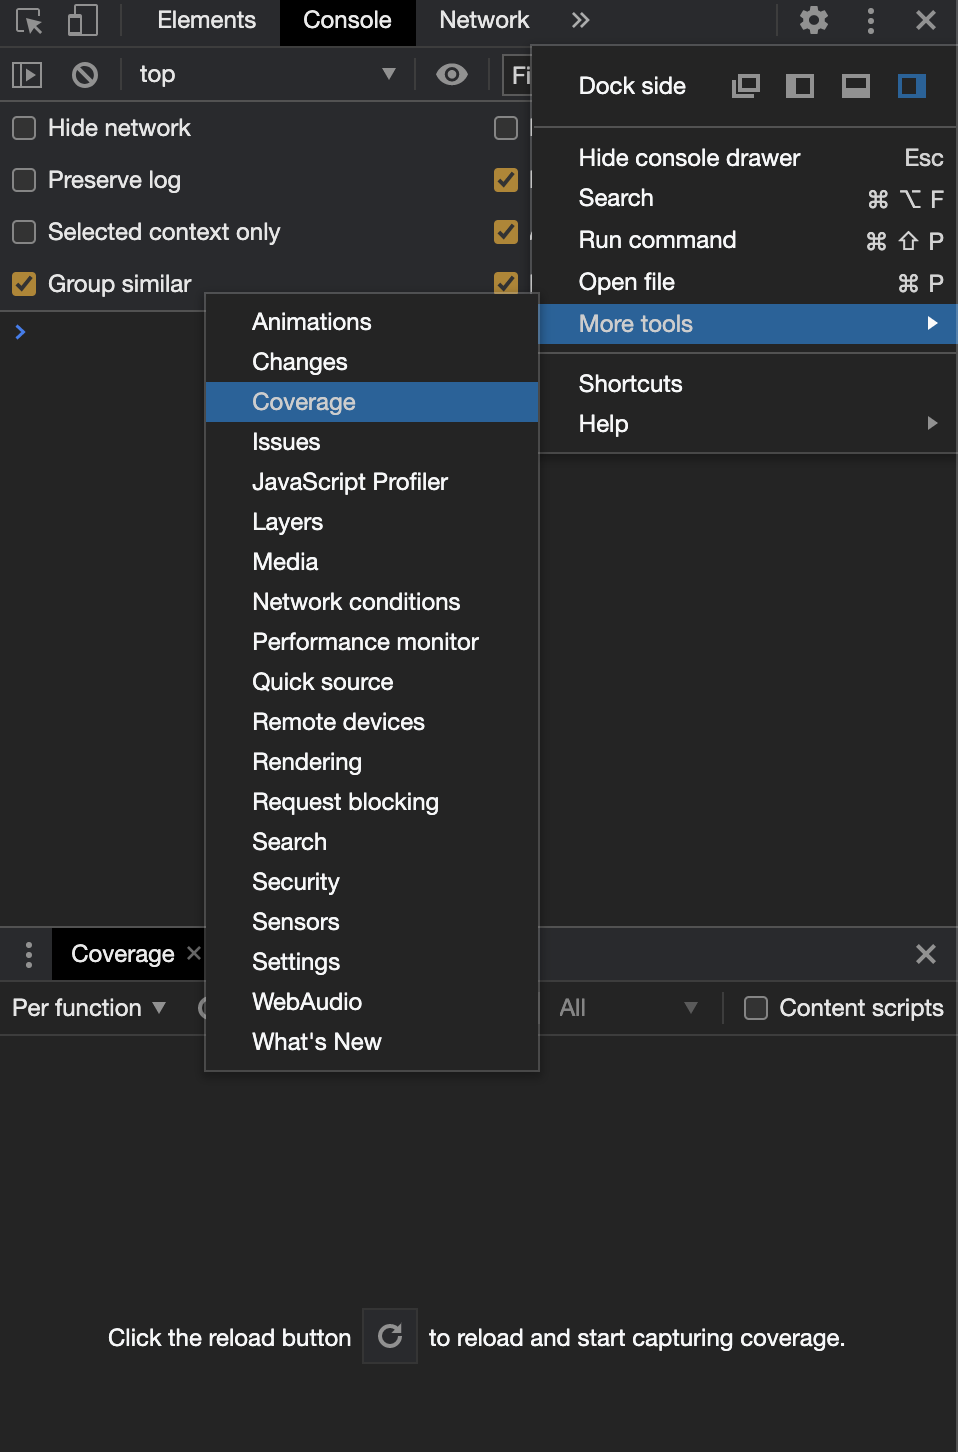
This will open up a coverage window.
Running a coverage
We can press the reload button in the coverage window to run a coverage.
By doing this, Chrome will re-index the page and show you all the results it found like this.
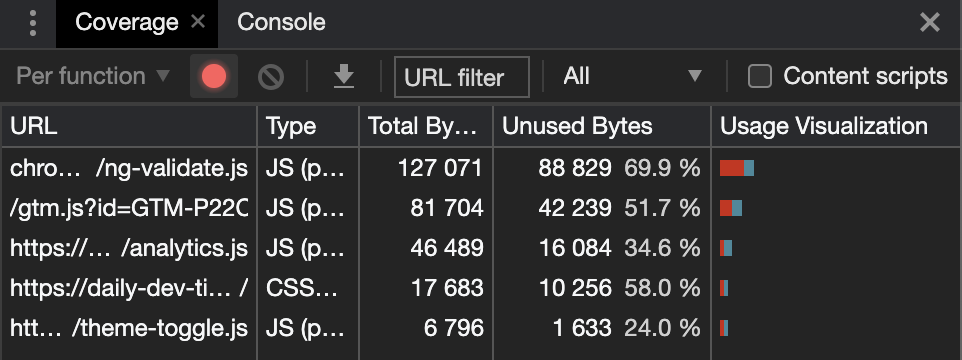
This is the high-level overview of the scripts and css loaded on the page. But how can we now see what's being used or not?
Click on one of the results to see it in detail.
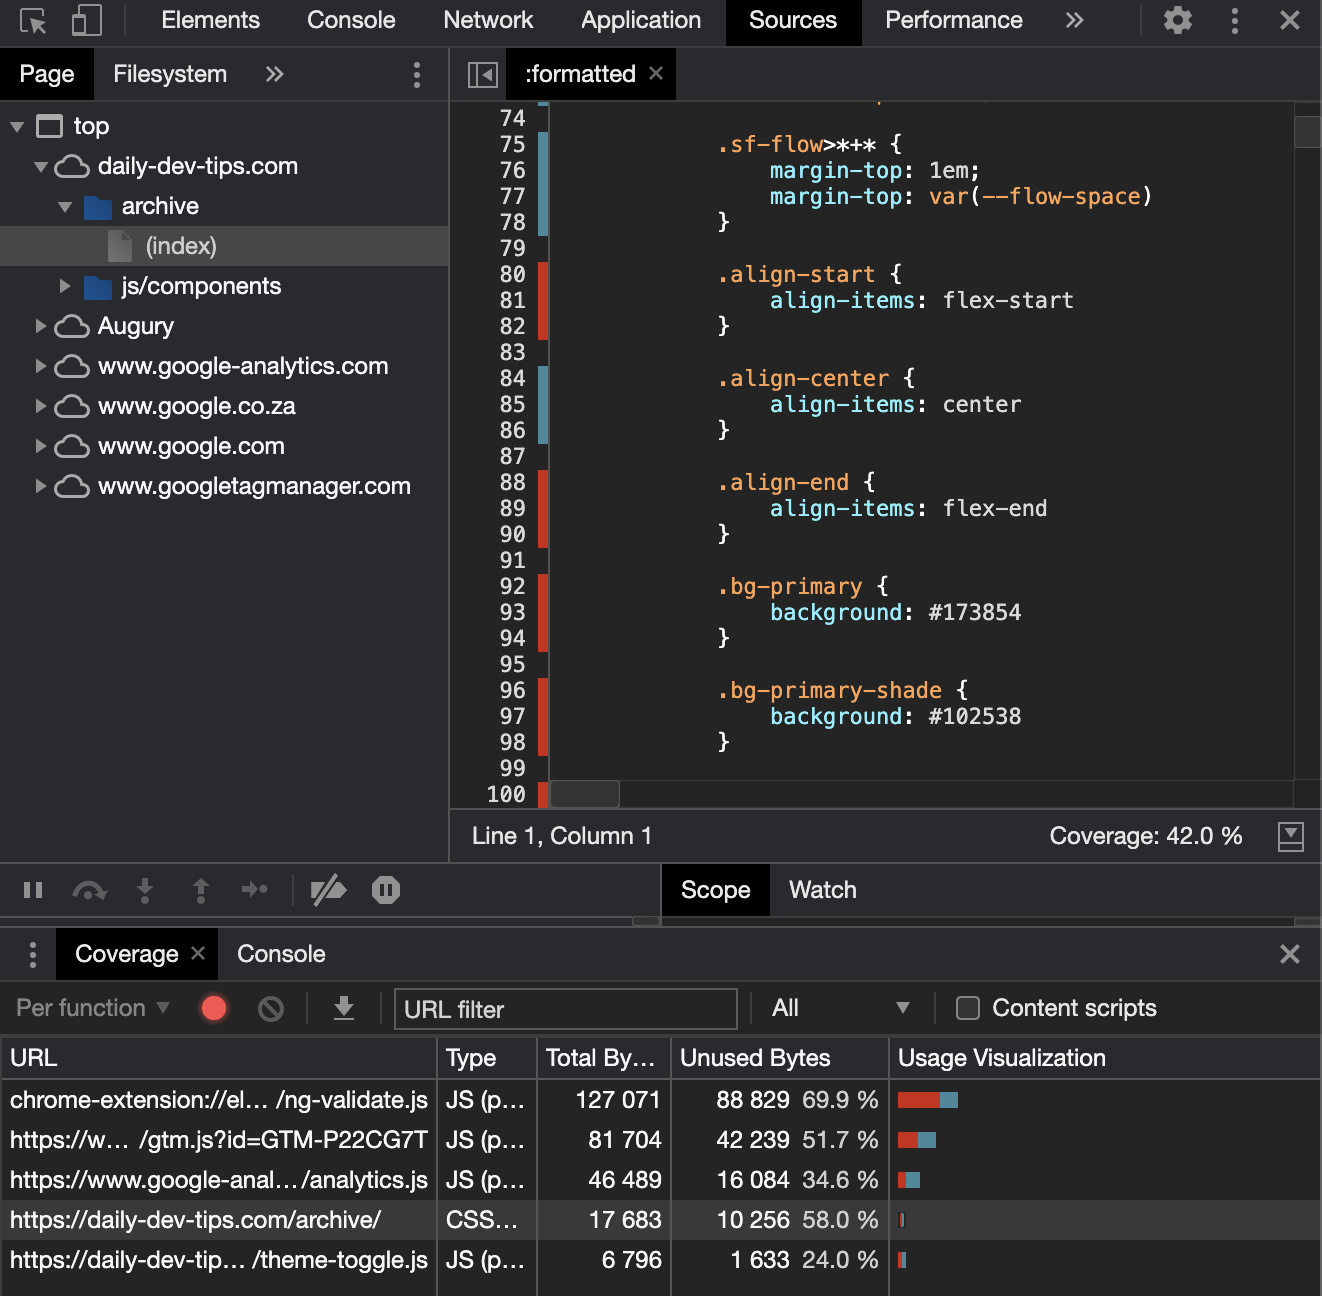
Here you see my inline CSS. Depending on the color, you can see if a line is being used or not.
In the above example, the red lines are not being used.
Do be aware when removing the CSS. It might be used on another page!
So this is cool. It will give you at least a starting ground if you want to optimize it to the next level!
It also works for JavaScript, but this JavaScript might not have been fired yet.
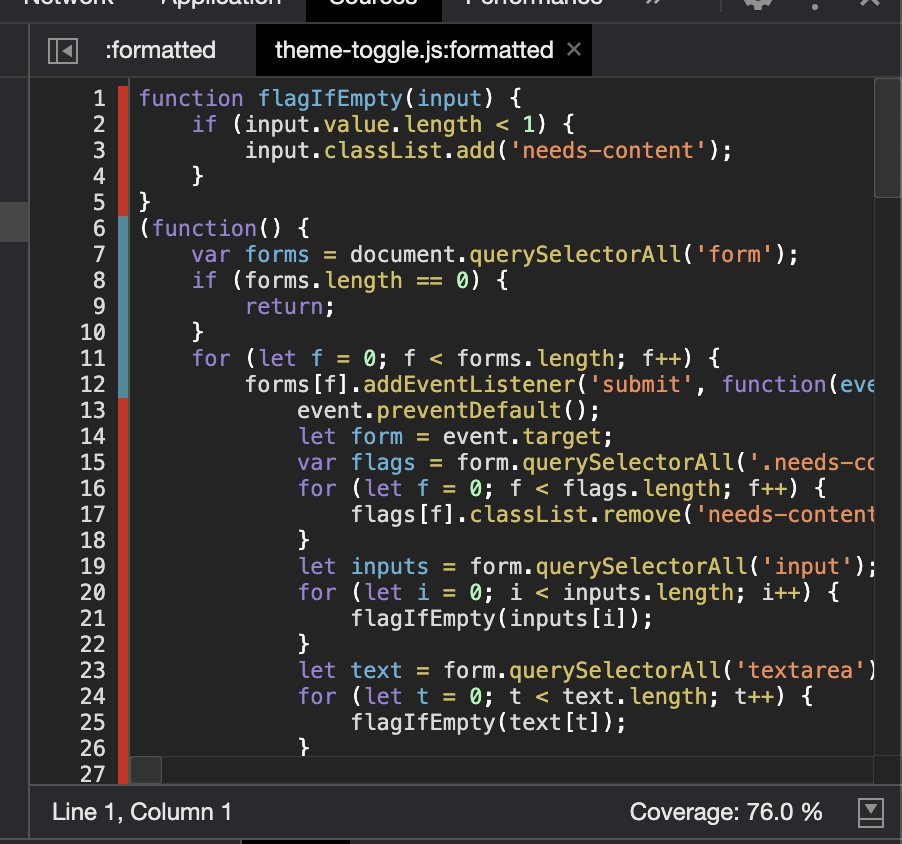
Exporting this data
There is also the option to export these results from the coverage. You could use another tool to remove these lines from your code automatically.
You can find the export in the coverage window.

Thank you for reading, and let's connect!
Thank you for reading my blog. Feel free to subscribe to my email newsletter and connect on Facebook or Twitter
